Hard data on the most dangerous roads in the community has been unearthed by the District of Mission’s developing Transportation Master Plan.
TranSafe, a consultant hired by the municipality, has collected police and ICBC statistics to create a picture on what streets have the most crashes, where the most injuries and fatalities occur, where pedestrians are struck, weather and surface conditions, along with numerous other contributing factors.
From 2015 to 2019, there were 687 collisions in Mission resulting in an injury, according to the police database. ICBC’s database records 2,213 injury claims resulting from crashes during the same period.
Vulnerable road users (pedestrians, cyclists, motorcycles) accounted for 15 per cent of these crashes. Between one and two per cent of all injury crashes were fatal, with police recording 14 fatalities and ICBC recording 16.
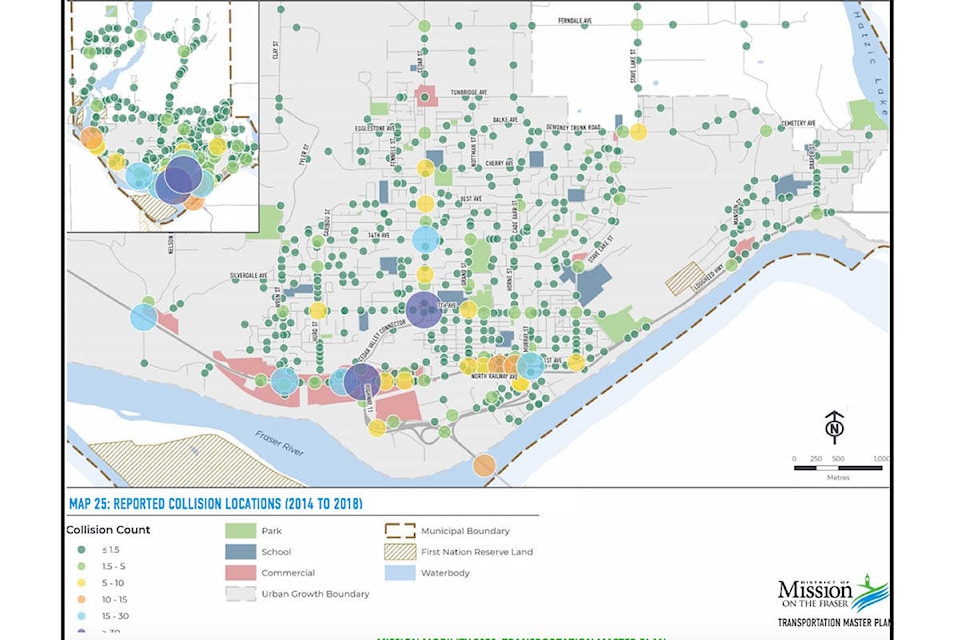
According to ICBC statistics, the biggest intersection-crash hotspots during those five years were: The Lougheed Highway and Highway 11-Cedar Valley Connector intersection (325 injuries); Cedar Street and 7th Avenue intersection (93); 1st Avenue-Glasgow Avenue-Murray Street intersection (72); Lougheed Highway-Wren Street intersection (72); and 14th Avenue-Cedar Street intersection (54).
| ICBC statistics showing which intersections resulted in the most injury claims from 2015 to 2019. |
The data provided by police corresponds to the ICBC’s top three crash intersections, however the numbers of crashes recorded are significantly less.
The most collision-prone streets, according to police data, were Highway 11 (10.7 crashes per kilometres), the Mission Bridge (8.7 per km), Lougheed Highway (8.2 per km), 1st Avenue (7.5 per km), and Hurd Street (7.5 per km).
Police say the most significant crash factors were: inattentive drivers, causing 228 injuries and 5 fatalities; failure to yield, 56 injuries and one fatality; suspected alcohol, 42 injuries and one fatality; and driving too fast and exceeding the speed limit, 43 injuries and one death.
During the sample period, the number of 90-degree-intersection-turn collisions (67 injuries), and head-on collisions (31 injuries) were relatively high, according to TranSafe’s analysis. These maneuvers also resulted in the most fatalities (3 and 5, respectively).
| The maneuvers that caused crashes resulting in injuries (green), and fatalities (red), according to police statistics. |
The consultant notes a high proportion of collisions occur mid block, indicating speed as a factor.
Environmental conditions also factored into serious accidents, with 23 per cent occurring in adverse weather, 35 per cent occurring when road surfaces were slippery, and 35 per cent occurring at times of poor lighting. Most of the fatalities occurred in the Fall and Winter months.
For the five years in question, 61 pedestrians were struck, which resulted in two deaths, police statistics show.
Their data show the most-frequent areas for a person to be hit were: 7th Avenue, accounting for 13 injuries; Lougheed Highway, seven injuries and one death; and Cedar Street, six injuries and one death.
| The intersections where pedestrians were struck most frequently, according to ICBC statistics. The numbers represent the number of incidents from 2015 to 2019. |
Approximately 33 per cent of the pedestrian incidents occurred in adverse weather conditions (20 per cent when roads were slippery), and 46 per cent occurred during dark conditions, and 23 per cent occurred at signalized intersections. People were more likely to be struck in the Fall, which suggests visibility is an issue.
The data patterns indicate overall collision frequency has gradually declined since 2015, with a significant drop in 2019. This “may be related to changes in reporting and the impacts of the District’s road safety efforts,” according to TranSafe’s report.